
Happy New Year everyone,
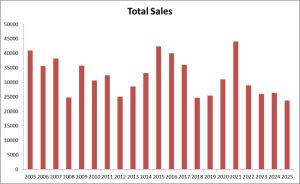
With 2025 now concluded, we can safely say this is a year that will go into the history books. With all the ups and downs in our economy, political changes, currency fluctuations, and immigration policies, 2025 ended up having one of the lowest annual sales totals in over twenty years. At the same time, we also saw the highest number of new listings in a single year since the mid-1990s, slightly eclipsing the previous record set in 2008 by just over 1,000 listings.
This was definitely not what most people predicted at the start of 2025. After a weak 2023 and 2024, combined with a heating market at the end of 2024, many were expecting at least a mild rebound year. However, that outlook shifted quickly once trade tensions between Canada and our neighbour to the south, the U.S., escalated. The negative impact from that dominated our market until it finally began to ease in the latter part of 2025.
I’ve included a graph of total sales to show how this past year compares to the last 20 years.
When you combine record-low sales with a record number of new listings, it’s no surprise that prices began to decline across all property types starting in early 2025—regardless of how mortgage costs moved throughout the year.
To give a clearer picture of how different product types in different cities performed, I’ve included HPI Year-over-Year changes, broken down by property type and city.
Before you look at the chart, I want to quickly explain HPI pricing, because it’s not as straightforward as average or median pricing.
HPI pricing, unlike averages or medians, tracks the value of a “typical” home over time. It compares similar homes to similar homes, which helps remove distortion from luxury sales or changes in the mix of what sold in a given month.
HPI looks at thousands of actual sales in each market and builds a “benchmark” home for each property type. That benchmark reflects homes that:
- Sell regularly
- Represent the middle of the market
- Share common characteristics for that area (size, age, location, features)
By tracking how homes similar to that benchmark perform over time, HPI shows true price movement, not just changes in what happened to sell that month.
This is why HPI is often preferred: traditional numbers like averages or medians can swing simply due to sales mix. For example, if more high-end homes sell in a given month, it can make it look like prices “went up,” even if the underlying market didn’t actually improve.
While you’re looking at the chart below, please keep in mind that HPI is a market trend tool—it is not meant to tell you your home’s exact value.
With that being said, without further ado, please review the chart below.
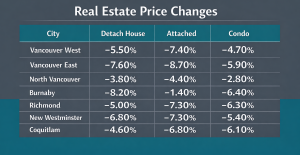
From a quick glance, a few key points stand out:
- North Vancouver clearly fared the best during the 2025 downturn when you look across all product types.
- Burnaby townhomes saw the least amount of downward pressure on pricing through 2025, while Burnaby detached homes and condos experienced some of the worst declines. This was especially surprising given that Brentwood townhome prices actually stayed completely flat through 2025.
- East Vancouver seems to have been hit the hardest overall when you average all product types. This does make sense, as East Vancouver was one of the best-performing markets during the COVID-era craziness, so it had more room to correct.
Of course, a big reason why sales activity began to improve slightly toward the end of the year is because prices continued to come down.
As usual, I’ve also expanded the Year-over-Year price trend that I’ve been presenting in the last several newsletters.
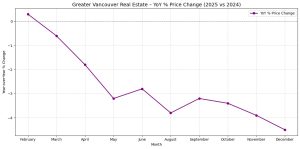
The Year-over-Year price decline actually deepened into year-end, reaching its sharpest drop in December at -4.5%. This clearly indicates that even though sales activity improved, prices did not. In fact, the downward pressure on pricing increased.
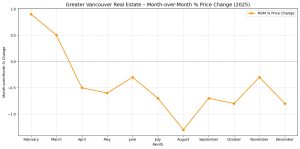
As we flip into 2026, I’m also introducing a new price trend tracker that focuses more on Month-over-Month (MoM) price changes. The biggest difference between the YoY and MoM charts is the story they tell.
- Year-over-Year (YoY) price change compares today’s home prices to the same time last year. It gives a big-picture, long-term view of how the market is trending.
- Month-over-Month (MoM) price change compares prices to the previous month, showing short-term momentum and real-time shifts.
YoY is great for spotting broader market cycles, while MoM tells you what’s happening right now—whether prices are rising, falling, or starting to stabilize. Together, they give you both the zoomed-out trend and the immediate pulse of the market.
When you combine both the YoY and MoM charts, they tell a very vivid story:
Our prices didn’t “crash” suddenly. It has been a consistent and gradual decline throughout 2025. Even though November 2025 showed a smaller decline, that improvement was quickly erased by a 0.8% drop in December, which suggests the market still hasn’t found a floor as we move into 2026.
Looking Forward – My 2026 Outlook:
We’ll take a break from going deep into mortgage numbers in this newsletter, and instead I want to share my personal outlook for 2026.
Supply Side
We enter 2026 with elevated standing inventory:
- 14.6% higher than December 2024
- 34.8% above the 10-year average
That means we already have a lot more inventory to work through. When you add in:
- Sellers who tried to list in 2025 but pulled their homes off the market to “take a break,” and
- New sellers who plan to list in 2026,
it becomes very easy to see how inventory levels could continue to climb, especially if buyer demand doesn’t catch up.
I’ve already spoken with many colleagues, and most are telling me they have NUMEROUS listings lined up for Spring 2026—much more than typical for this time of year. Generally, if 8–10 agents are all telling you the same thing, it’s a pretty good sign it’s happening across the market.
As a result, I expect we’ll continue to see a flood of “new” listings in the first half of the year.
Demand Side
On the demand side, with prices decreasing month after month, I expect sales activity in 2026 to be stronger than 2025, when many buyers were stunned by the sudden trade tensions between Canada and the U.S.
However, I also believe there will be a ceiling on how much demand can grow, for a few reasons:
- Downward pressure on population
It’s no secret that Canada—especially B.C. and Ontario—is seeing not just temporary residents, but also Canadian citizens, leaving the country or moving to other provinces. With population growth slowing or reversing, fewer people need housing, whether to rent or to own.
- A brutal rental market in 2025
The rental market has been just as challenging as the sales market. This is driven by two factors:
- The population trends mentioned above, and
- The completion of a large wave of purpose-built rental buildings throughout Greater Vancouver. In 2026, Greater Vancouver is expecting another 6000-8000 of newly built purpose built rental units to go online.
Together, these have led to continuously falling rents. As rents decline, it has two major impacts:
- Investors may stay on the sidelines because rental returns—already razor thin—are now even harder to justify.
- First-time buyers may choose to keep renting longer, especially with more new, modern purpose-built rentals available at lower or more competitive rates.
3. Foreign buyer restrictions
- Foreigners are still unable to purchase residential real estate in Canada, which limits the pool of non-Canadian buyers who can participate in our market.
4. Affordability is better—but still tough
Even after the recent price drops, Greater Vancouver is still one of the most expensive places in North America to own a home relative to local incomes. For a typical dual-income couple working here, buying is still extremely difficult.
When you combine the supply story with the demand story, it’s not hard to see that new listings will likely continue to outpace demand.
As long as that remains the case, there’s no strong reason to expect a meaningful price recovery just yet. As the HPI chart shows, some sub-markets will perform better than others, but the overall trend should continue to lean downward.|
That said, there is a silver lining: the rate of decline we see in 2026 will likely be more modest than what we experienced in 2025.
Here’s why:
- The Bank of Canada has signaled that mortgage rates will likely remain relatively stable. That stability helps buyers run their numbers with more confidence and worry less about sudden jumps in borrowing costs.
- The shock and aftermath of the trade tensions with the U.S. are starting to fade. People are more prepared—both financially and mentally—for the economic impact, which adds another layer of stability.
- As prices continue to gradually decline, more buyers—some who have been waiting on the sidelines for years—will finally feel that prices and payments are getting closer to their comfort zone.
To put it simply:
Stability = less anxiety = less fear about the future = more willingness to commit.
That’s all for this month’s newsletter. We’ll return to our regular format next month, where we’ll again track mortgage trends, rental rates, and the market’s monthly performance together.
If you have any questions about buying, selling, investing, or just want to plan your next move, I’m always happy to chat.
Stay warm, everyone!
Joe Lee PREC*